Error Model & ASVs
DADA2 Error Model
The DADA2 error model attempts to assess whether a sequence is too abundant to be explained by errors in amplicon sequencing.
Here we will leverage this model to learn error rates and then plot them:
# Learn Error Rates

# dada2 uses a parametric model to learn the error rates
# for each sequence
errForward <- learnErrors(filtForward)
errReverse <- learnErrors(filtReverse)

# plot the error rate against theoretical error rates
plotErrors(errForward,nominalQ=TRUE)
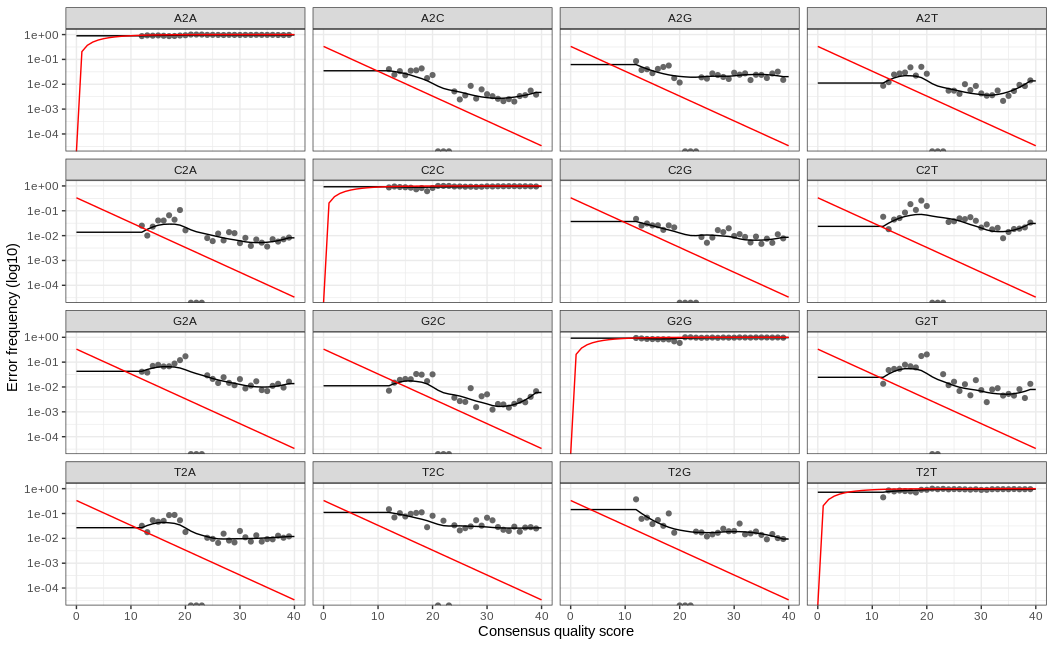
!!! info So the red line indicates our expected error rate. Essentially, as the quality score gets better so does our error rate. The black points/line our are actual error rates and we are looking for the trend of the black line to match the trend of the red line. Here we expect a little deviation since our sample has been subsampled.
Inferring Sequence Variants
So far, we have assigned p-values for each sequence in each sample
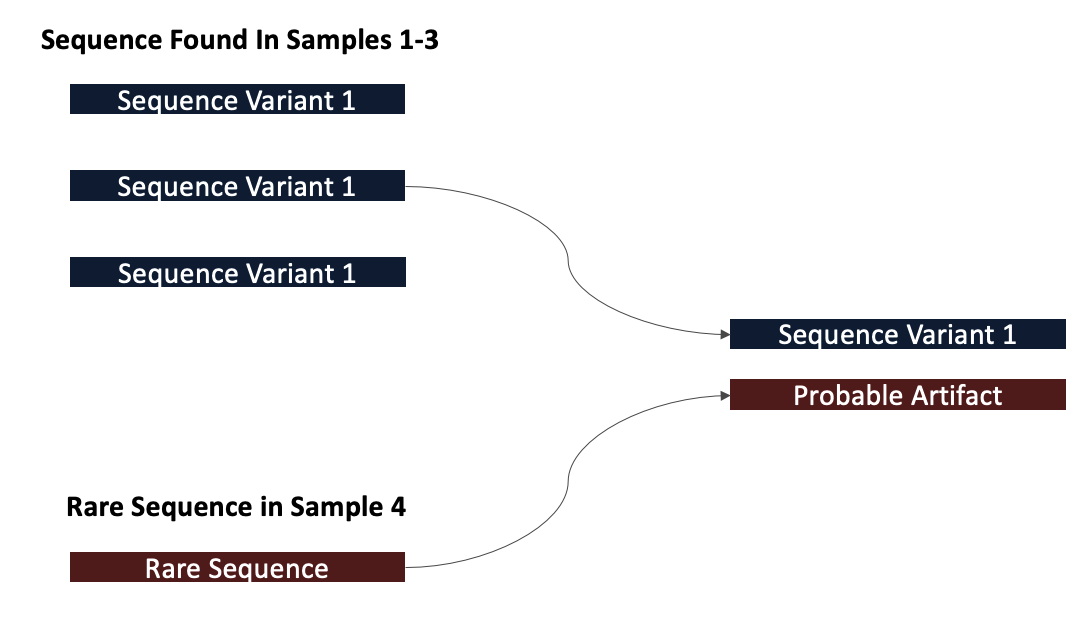
DADA2 then tries to determine which sequences are of biological origin and which aren’t by assessing which sequences are present in other samples
If a sequence is present in another sample, it is more likely that it is a real biological sequence
# Infer Sequnce Variants

# we will now run the dada2 algorithm
# this algorithm delivers "true" sequence variants
# with information gathered from the error model
# generated above
dadaForward <- dada(filtForward, err=errForward)
dadaReverse <- dada(filtReverse, err=errReverse)

# let's get a summary of our first sample
dadaForward[[1]]
dada-class: object describing DADA2 denoising results
35 sequence variants were inferred from 430 input unique sequences.
Key parameters: OMEGA_A = 1e-40, OMEGA_C = 1e-40, BAND_SIZE = 16
Note
Here we note that even though we have 430 unique sequences in our data, only 35 of them have been deemed true sequence variants.